Whether you’re trading stocks, forex, commodities, or crypto — one skill that can help you make better decisions is technical analysis. If you’ve ever seen charts full of lines, candles, and indicators, and wondered what they meant, this guide is for you.
In this detailed blog, we’ll break down what technical analysis is, how it works, its benefits and limitations, the tools involved, and how beginners can start using it step-by-step.
🔹 Introduction: Why Technical Analysis Matters
Markets are driven by two major forces: data and psychology. While fundamental analysis looks at the financial health of a company or asset, technical analysis focuses on market behavior — price, volume, patterns, and trends.
That means you don’t need insider access or deep financial knowledge to trade smart — you just need to read the charts.
🔹 What Is Technical Analysis?
Technical analysis (TA) is the study of historical market data — primarily price and volume — to predict future price movements. It is based on the assumption that price moves in trends and tends to repeat itself over time.
TA is used by traders to:
Identify entry and exit points
Understand momentum and volatility
Set stop-loss and target levels
Avoid emotional decisions
Unlike long-term investing, which relies on company fundamentals and earnings, technical analysis is ideal for traders — who want short- to medium-term price movements.
🔹 Key Principles of Technical Analysis
There are three core beliefs behind TA:
1. Price Discounts Everything
Every factor — news, earnings, politics — is already included in the price.
2. Prices Move in Trends
Markets move in uptrends, downtrends, or sideways. Identifying the trend early gives traders an edge.
3. History Repeats Itself
Market psychology is predictable. Certain patterns and behaviors repeat, allowing you to make data-backed decisions.
🔹 Types of Price Charts
Visual representation of price is the foundation of TA. The most common types include:
🟢 Line Chart
Connects closing prices over time
Simple and clear but lacks detail
🔵 Bar Chart
Shows open, high, low, and close (OHLC)
Offers more data for analysis
🔴 Candlestick Chart (Most Popular)
Visual and colorful
Green (bullish) and red (bearish) candles
Helps identify patterns and trends
Each candle tells a story: if buyers or sellers are in control, how strong the move is, and if a reversal might happen.
🔹Understanding Market Trends
📈 Uptrend
Higher highs and higher lows
Indicates bullish market sentiment
📉 Downtrend
Lower highs and lower lows
Indicates bearish sentiment
➖ Sideways Trend (Consolidation)
Range-bound movement
Traders wait for a breakout
Identifying the trend is the first step before placing any trade.
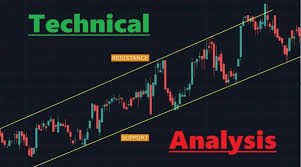
🔹 Support and Resistance
These are the most important levels in technical analysis.
Support: A price level where demand increases and price tends to bounce back up
Resistance: A level where supply increases and price tends to fall
When support breaks → downtrend
When resistance breaks → uptrend
You can draw these zones using horizontal lines, trendlines, or Fibonacci levels.
🔹 Popular Technical Indicators
Indicators help you analyze momentum, strength, trends, and volatility.
Here are the most beginner-friendly indicators:
📌 1. Moving Averages (MA)
Smooths price over time
Simple MA and Exponential MA
Golden Cross (Bullish) or Death Cross (Bearish) signals
📌 2. Relative Strength Index (RSI)
Measures overbought or oversold conditions
Scale from 0 to 100
Above 70: Overbought
Below 30: Oversold
📌 3. MACD (Moving Average Convergence Divergence)
Shows trend strength and reversals
Bullish or bearish crossovers indicate entries/exits
📌 4. Bollinger Bands
Shows volatility based on standard deviation
When price hits bands, a reversal or breakout may occur
📌 5. Volume
Confirms price movement strength
Rising price with low volume = weak
Rising price with high volume = strong move
🔹 Chart Patterns to Recognize
Technical analysis is full of repetitive chart patterns. Some of the most reliable ones include:
✅ Reversal Patterns
Head and Shoulders: Trend reversal signal
Double Top / Double Bottom
Morning Star / Evening Star Candlesticks
✅ Continuation Patterns
Flags and Pennants
Triangles (Ascending, Descending, Symmetrical)
Learning these patterns allows you to anticipate potential breakouts or breakdowns.
🔹 Timeframes and Trading Styles
Your choice of chart timeframe depends on your trading style:
| Trading Style | Timeframe Used | Trade Duration |
|---|---|---|
| Scalping | 1-min / 5-min | Seconds to minutes |
| Day Trading | 5-min to 15-min | Same day |
| Swing Trading | 1-hour to 1-day | Days to weeks |
| Position Trading | Daily / Weekly | Weeks to months |
Tip: Start with higher timeframes to understand the big picture, then zoom in for trade entries.
🔹 Technical Analysis vs. Fundamental Analysis
| Feature | Technical Analysis | Fundamental Analysis |
|---|---|---|
| Focus | Price, volume, patterns | Company performance, valuation |
| Timeframe | Short to medium-term | Long-term investment |
| Tools Used | Charts, indicators, trendlines | Balance sheets, ratios, news |
| Decision Basis | Market psychology | Company/institutional performance |
Many successful traders combine both methods to maximize accuracy.
🔹 Limitations of Technical Analysis
While technical analysis is powerful, it’s not foolproof.
Doesn’t consider macroeconomic or geopolitical events
Over-reliance on indicators can confuse beginners
False breakouts can trap traders
Requires consistent practice and discipline
Always combine TA with proper risk management.
🔹 How to Start Using Technical Analysis as a Beginner
Here’s a simple step-by-step plan for beginners:
Choose a charting platform (TradingView, Zerodha Kite, Upstox, etc.)
Learn 2–3 basic indicators (like RSI and Moving Averages)
Draw support and resistance manually
Practice identifying patterns
Use demo accounts to test strategies
Track your results and mistakes in a trading journal
🔹 Top Resources to Learn Technical Analysis
Books:
Technical Analysis of the Financial Markets by John Murphy
Japanese Candlestick Charting Techniques by Steve Nison
Courses:
Zerodha Varsity (Free)
Udemy, Coursera, or NSE Academy
YouTube Channels:
Booming Bulls, Elearnmarkets, TradingwithRayner
Communities:
Reddit (r/IndianStockMarket, r/Forex)
Discord groups or Telegram channels
🔹 Final Words: Mastering Technical Analysis Takes Time
Technical analysis is both an art and a science. It helps you read the emotions and psychology behind every price move, giving you a competitive edge in trading.
If you’re new, don’t rush. Start small, stay consistent, and never trade without a plan. With time and practice, the charts will begin to make sense — and your trades will become smarter, more confident, and more profitable.